CMF / CRF Details
CMF ID: 2730
Change 85th percentile speed from X to Y
Description:
Change the daily 85th percentile speed of a rural roadway from X to Y
Prior Condition: rural road with an 85th percentile speed of X mph
Category: Speed management
| Crash Modification Factor (CMF) |
|---|
| Value: | 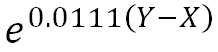 |
| Adjusted Standard Error: | |
| Unadjusted Standard Error: | |
| Crash Reduction Factor (CRF) |
|---|
| Value: | 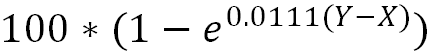 |
| Adjusted Standard Error: | |
| Unadjusted Standard Error: | |
| Applicability |
|---|
| Crash Type: | All |
| Crash Severity: | All |
| Roadway Types: | Not Specified |
| Street Type: | |
| Minimum Number of Lanes: | |
| Maximum Number of Lanes: | |
| Number of Lanes Direction: | |
| Number of Lanes Comment: | |
| Crash Weather: | Not specified |
| Road Division Type: | |
| Minimum Speed Limit: | |
| Maximum Speed Limit: | |
| Speed Unit: | |
| Speed Limit Comment: | |
| Area Type: | Rural |
| Traffic Volume: | Minimum of 35 to Maximum of 1468 Average Daily Traffic (ADT) |
| Average Traffic Volume: | 283 Average Daily Traffic (ADT) |
| Time of Day: | All |
| If countermeasure is intersection-based |
| Intersection Type: | |
| Intersection Geometry: | |
| Traffic Control: | |
| Major Road Traffic Volume: | |
| Minor Road Traffic Volume: | |
| Average Major Road Volume : | |
| Average Minor Road Volume : | |
| Development Details |
|---|
| Date Range of Data Used: | 1995 to 2005 |
| Municipality: | |
| State: | WY |
| Country: | USA |
| Type of Methodology Used: | Regression cross-section |
| Sample Size (crashes): | 1413 crashes |
| Other Details |
|---|
| Included in Highway Safety Manual? | No |
| Date Added to Clearinghouse: | Mar 21, 2011 |
| Comments: | This pair of CMF and CRF equations was obtained from Model #7 (see pg. 57).The researchers removed two outliers prior to modeling (p. 55). This fact must be kept in mind when computing sample size, average ADT, etc.Only 1 week of field data was collected to estimate the traffic volumes and 85th percentile speeds, and no traffic volume conversion factors were used to adjust for seasonal variations in traffic. On the other hand, 10 years of crash data were used. Thus, there was a major disparity in the accuracy of the response variable relative to the predictor variables. The functional classification of the sample used was never specified. The researchers began with crash data from all functional classifications (p. 48), but they screened out the all but the rural crashes. The tables in the report describing the sites (e.g Table 5.1 on p. 49) do not state functional classification either. |